Advanced Example
In this example, we will create the live data page for each sensor corresponding to the route /sensor/live/<id>.
Define the Page
Create a page under the pages/sensors/live directory with the name [id].tsx. This will be the page that will be rendered for each sensor. Make sure to import the Layout component from ~/components/layout and wrap the page content with it. This will ensure that the page will be wrapped in the default layout.
import Layout from "~/components/layout";

function Page() {
  return <Layout></Layout>;
}

export default Page;
Get the Sensor ID
Next, we need to get the sensor ID from the URL. We can do this by using the useRouter hook from next/router.
import { useRouter } from "next/router";
import Layout from "~/components/layout";

function Page() {
  const router = useRouter();

  if (!router.query.id) {
    return null; // Return null when the sensor ID is not available
  }

  return <Layout></Layout>;
}

export default Page;
The hook is asynchronous, so we need to make sure that we return null when the sensor ID is not available. This will prevent the page from rendering until the sensor ID is available.
Get the Sensor Data
We will use the useSubscribeById hook to get the sensor data. We will call the hook with the sensor ID from the URL (note how we cast the type to string | undefined this is because you can have an array of sensor IDs in the URL
but we do not support that, so to make TypeScript happy we need to cast the type to string | undefined).
Once we subscribe to the WS, we can display the subscription status using the WSStatus component from ~/components/ws-status.
![]()
import { useRouter } from "next/router";
import Layout from "~/components/layout";
import WSStatus from "~/components/ws-status";
import useSubscribeById from "~/websockets/useSubscribeById";

function Page() {
  const router = useRouter();

  const { connectionStatus, rtConnected, messageHistory } = useSubscribeById(
    router.query.id as string | undefined
  ); // Get the sensor data

  if (!router.query.id) {
    return null;
  }

  return (
    <Layout>
      <div className="flex items-center space-x-2">
        {/* Display the WebSocket Status */}
        <WSStatus
          connectionStatus={connectionStatus}
          rtConnected={rtConnected}
        />
      </div>
    </Layout>
  );
}

export default Page;
Create LiveMessageList Component
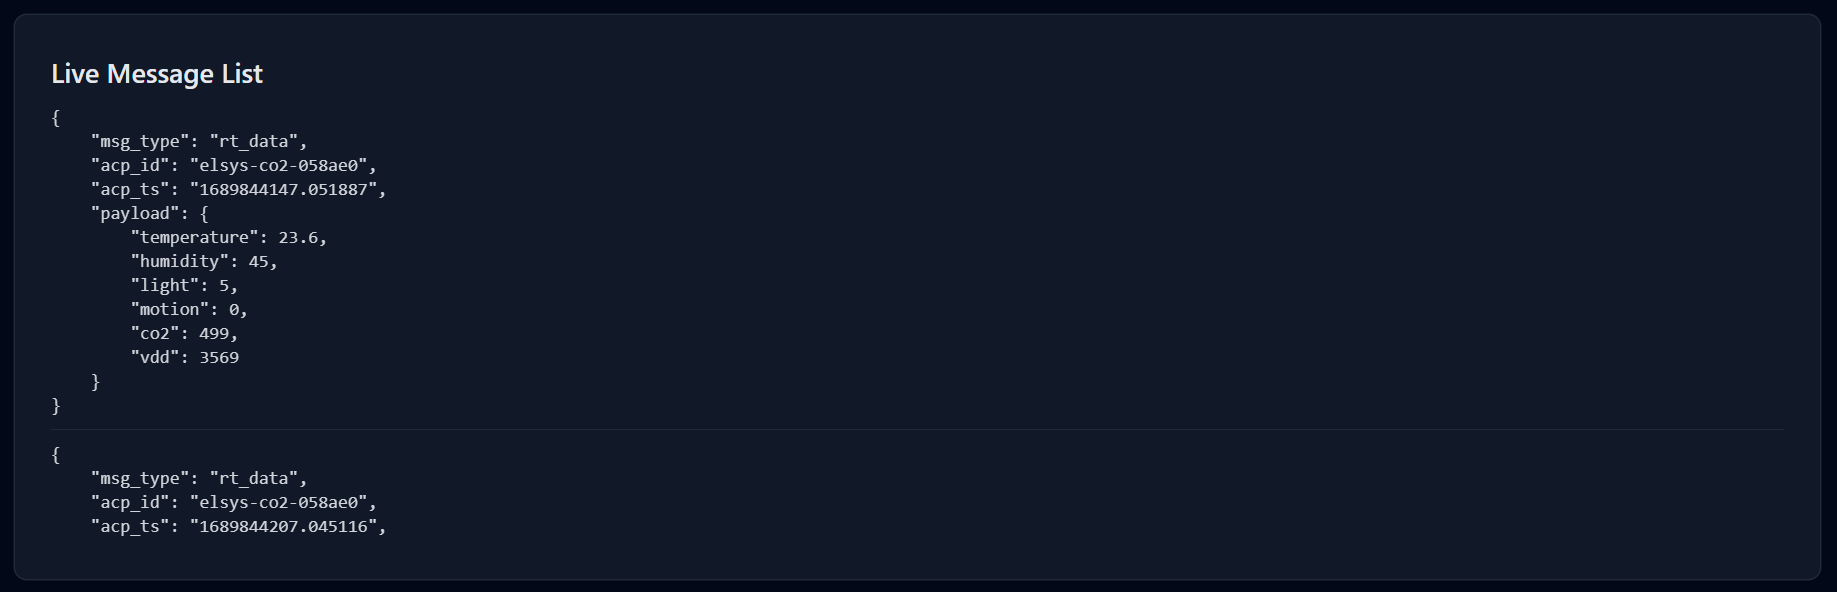
Now we have the websocket messages in messageHistory we could display in a subcomponet to prevent having everything in one file. This component will have a scrollable list which dislays all the messages in json and formatted nicely. We will call this component LiveMessageList. Lets create it in components/sensors/live-message-list.tsx
import React from "react";
import { ScrollArea } from "ui";
import { type ParsedMessage } from "~/websockets/useWS";
import { Card, List, ListItem, Title } from "@tremor/react";

interface LiveMessageListProps extends React.HTMLAttributes<HTMLDivElement> {
  // Extend the HTMLAttributes so we can pass in props like className
  sensorData: ParsedMessage[]; // The sensor data
}

const LiveMessageList: React.FC<LiveMessageListProps> = ({
  sensorData, // Destructure the sensor data
  ...props
}) => {
  return <Card {...props}>{/* Display the data here */}</Card>; // Return the card
};

export default LiveMessageList;
As you can see we just created a simple component that takes in the sensorData as prop ensuring to type it correctly as ParsedMessage[] which is the type of the messageHistory from the hook. We also extended the HTMLAttributes so we can pass in props like className to the component and we return a Card component from @tremor/react which is a wrapper around div with some styling.
Now lets display the data there.
import React from "react";
import { ScrollArea } from "ui";
import { type ParsedMessage } from "~/websockets/useWS";
import { Card, List, ListItem, Title } from "@tremor/react";

interface LiveMessageListProps extends React.HTMLAttributes<HTMLDivElement> {
  sensorData: ParsedMessage[];
}

const LiveMessageList: React.FC<LiveMessageListProps> = ({
  sensorData,
  ...props
}) => {
  return (
    <Card {...props}>
      <Title>Live Message List</Title>
      <ScrollArea className="h-[300px]">
        <List>
          {sensorData.map((message) => (
            <ListItem key={message.acp_ts}>
              <span className="whitespace-pre font-mono text-xs text-gray-700 dark:text-gray-300">
                {JSON.stringify(message, null, 4)}
              </span>
            </ListItem>
          ))}
        </List>
      </ScrollArea>
    </Card>
  );
};

export default LiveMessageList;
We display the JSON inside a span with some styling. It is important to pass a key prop to the ListItem component so React can keep track of the items in the list.
Now the LiveMessageList component is ready to be used in the page. i.e
import { useRouter } from "next/router";
import Layout from "~/components/layout";
import LiveMessageList from "~/components/sensors/live-message-list";
import WSStatus from "~/components/ws-status";
import useSubscribeById from "~/websockets/useSubscribeById";

function Page() {
  const router = useRouter();

  const { connectionStatus, rtConnected, messageHistory } = useSubscribeById(
    router.query.id as string | undefined
  );

  if (!router.query.id) {
    return null;
  }

  return (
    <Layout>
      <div className="flex items-center space-x-2">
        <WSStatus
          connectionStatus={connectionStatus}
          rtConnected={rtConnected}
        />
      </div>
      <LiveMessageList sensorData={messageHistory} className="mt-4" />
    </Layout>
  );
}

export default Page;
Create LiveCharts Component
Now this is the complicated component. This component will allow us to plot all the graphs of the data, filter by the graphs and compare the data between KPIs. We will call this component LiveCharts. Lets create it in components/sensors/live-charts.tsx
// !!! imports are omitted for brevity

interface LiveChartsProps extends React.HTMLAttributes<HTMLDivElement> {
  sensorData: ParsedMessage[];
}

const LiveCharts: React.FC<LiveChartsProps> = ({ sensorData, ...props }) => {
  const [filters, setFilters] = useState<string[]>(
    getAllAttributes(sensorData.map((message) => message.payload))
  );

  useEffect(() => {
    if (filters.length === 0) {
      setFilters(
        getAllAttributes(sensorData.map((message) => message.payload))
      ); // if no filters are selected, select all
    }
  }, [sensorData]);

  return (
    <div {...props}>
      <Flex>
        <div>
          <FacetedFilterButton
            filters={getAllAttributes(
              sensorData.map((message) => message.payload)
            )}
            selectedFilters={filters}
            setSelectedFilters={setFilters}
            title="Filter"
          />
        </div>
      </Flex>
    </div>
  );
};

// get all attributes from an object of { string: number}
const getAllAttributes = (obj: { [key: string]: number }[]) =>
  obj.reduce((acc, curr) => {
    Object.keys(curr).forEach((key) => {
      if (!acc.includes(key)) {
        acc.push(key);
      }
    });
    return acc;
  }, [] as string[]);

export default LiveCharts;
Here we scaffold a component that takes all the data then getAllAttributes that is present in the data, i.e all the KPIs and them sets them to the filters state. This state controls which KPIs are displayed in the charts. We also use the FacetedFilterButton component from ui to display the filters and allow the user to select which KPIs to display. The `useEffect sets the filters to all the KPIs on the first render.
Process Data
// !!! imports are omitted for brevity

interface LiveChartsProps extends React.HTMLAttributes<HTMLDivElement> {
  sensorData: ParsedMessage[];
}

const LiveCharts: React.FC<LiveChartsProps> = ({ sensorData, ...props }) => {
  const [filters, setFilters] = useState<string[]>(
    getAllAttributes(sensorData.map((message) => message.payload))
  );

  const allCharts: LineChartData[] = [];

  useEffect(() => {
    if (filters.length === 0) {
      setFilters(
        getAllAttributes(sensorData.map((message) => message.payload))
      ); // if no filters are selected, select all
    }
  }, [sensorData]);

  // create a chart for each filter and add it to the array
  filters.forEach((filter) => {
    allCharts.push({
      title: capilatizeFirstLetter(filter),
      data: {
        x: sensorData.map((message) => parseFloat(message.acp_ts) * 1000),
        y: sensorData.map((message) => message.payload[filter]),
      },
      xlabel: "Time",
      ylabel: capilatizeFirstLetter(filter),
      labels: [filter],
    });
  });

  return (
    <div {...props}>
      <Flex>
        <div>
          <FacetedFilterButton
            filters={getAllAttributes(
              sensorData.map((message) => message.payload)
            )}
            selectedFilters={filters}
            setSelectedFilters={setFilters}
            title="Filter"
          />
        </div>
      </Flex>
    </div>
  );
};

// get all attributes from an object of { string: number}
const getAllAttributes = (obj: { [key: string]: number }[]) =>
  obj.reduce((acc, curr) => {
    Object.keys(curr).forEach((key) => {
      if (!acc.includes(key)) {
        acc.push(key);
      }
    });
    return acc;
  }, [] as string[]);

export default LiveCharts;
Now we process the data and create a chart for each filter and add it to the allCharts array. We use the capilatizeFirstLetter function to capitalize the first letter of the KPI. We also use the LineChartData type from ui to type the allCharts array.
Display the Charts
// !!! imports are omitted for brevity
interface LiveChartsProps extends React.HTMLAttributes<HTMLDivElement> {
sensorData: ParsedMessage[];
}
const LiveCharts: React.FC<LiveChartsProps> = ({ sensorData, ...props }) => {
const [filters, setFilters] = useState<string[]>(
getAllAttributes(sensorData.map((message) => message.payload))
);
const allCharts: LineChartData[] = [];
useEffect(() => {
if (filters.length === 0) {
setFilters(
getAllAttributes(sensorData.map((message) => message.payload))
); // if no filters are selected, select all
}
}, [sensorData]);
// create a chart for each filter and add it to the array
filters.forEach((filter) => {
allCharts.push({
title: capilatizeFirstLetter(filter),
data: {
x: sensorData.map((message) => parseFloat(message.acp_ts) * 1000),
y: sensorData.map((message) => message.payload[filter]),
},
xlabel: "Time",
ylabel: capilatizeFirstLetter(filter),
labels: [filter],
});
});
return (
<div {...props}>
<Flex>
<div>
<FacetedFilterButton
filters={getAllAttributes(
sensorData.map((message) => message.payload)
)}
selectedFilters={filters}
setSelectedFilters={setFilters}
title="Filter"
/>
</div>
</Flex>
<div>
{allCharts.map((chart) => (
// For all selected charts, create a line chart
<LineChart
key={chart.title}
{...chart}
dateTime // use date time for x axis (UNIX timestamp)
chartType="svg" // SVG as WebGL does not allow for more than 8 lines
/>
))}
</div>
{allCharts.length > 1 && (
// If there are more than 1 charts, then show the comparison chart component
<LineComparison className="mt-8" allData={allCharts} />
)}
</div>
);
};
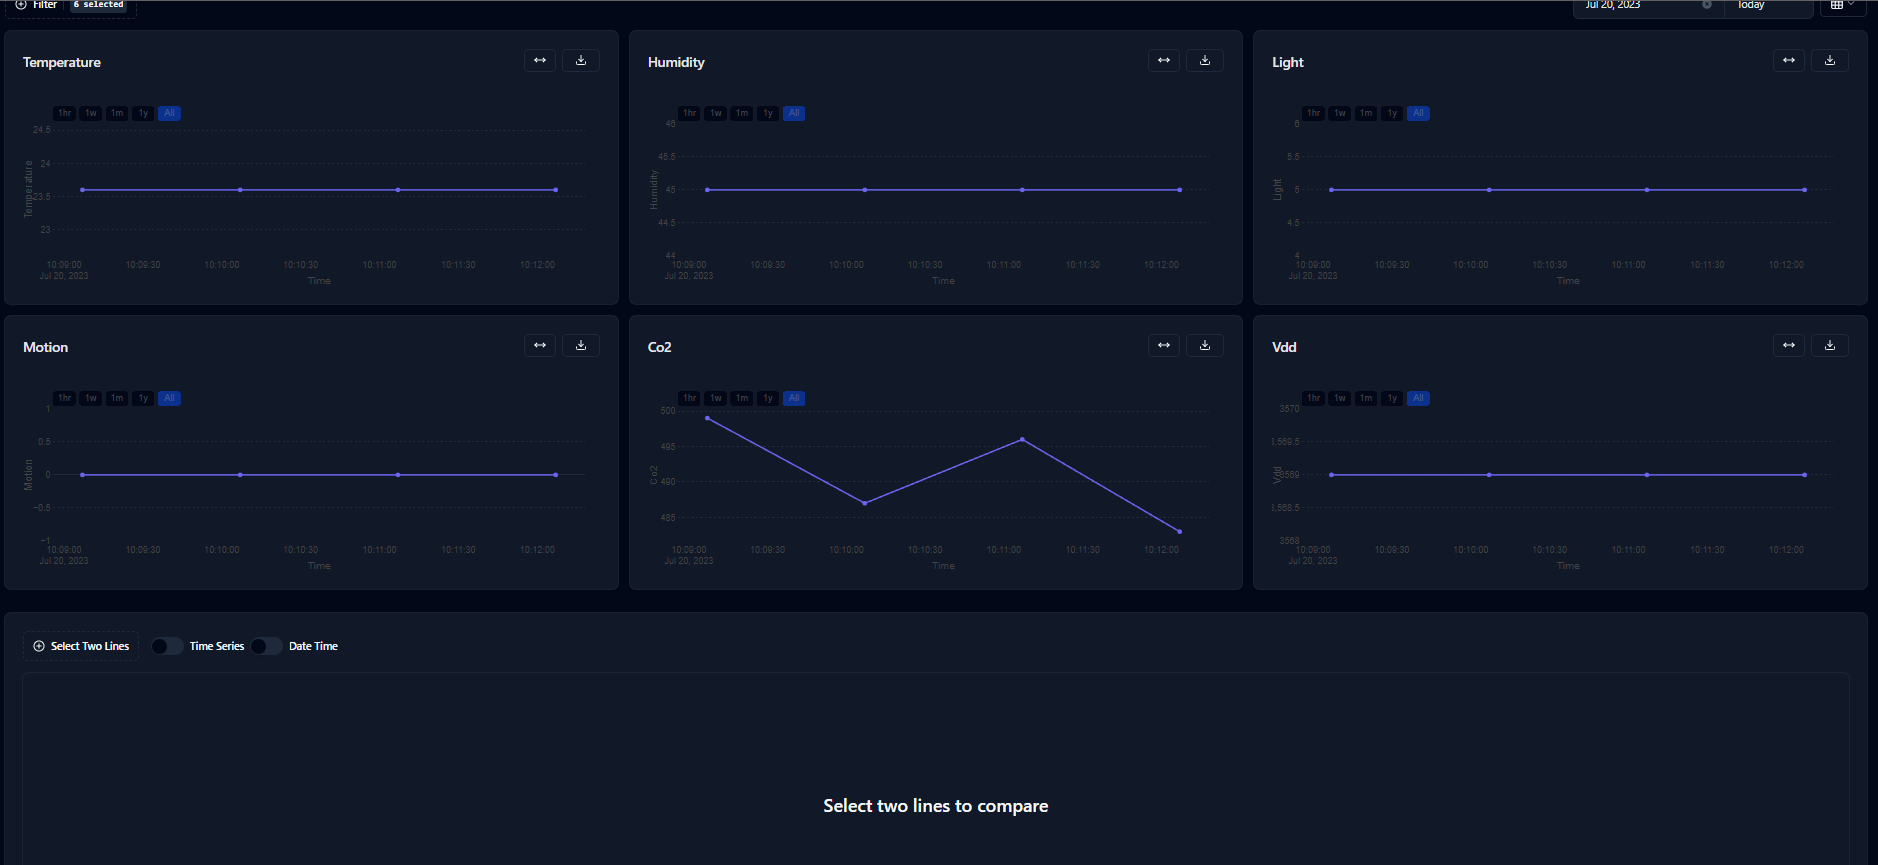
// omitted getAllAttributes functionNow we map over the allCharts array and create a LineChart for each chart. We also pass in the allCharts array to the LineComparison component to allow the user to compare the charts.
Grid Layout and Date Time selection
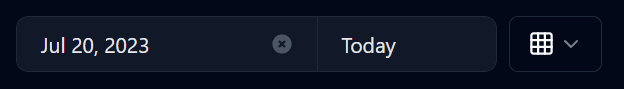
We want to user to be able to change the number of columns to display the graphs in, this allows the graphs to be seen more clearly. Also we would like to select date times for quering the data.
import {
  DateRangePicker,
  Flex,
  type DateRangePickerValue,
} from "@tremor/react";
import { Grid, LayoutGrid, Rows } from "lucide-react";
import React, { useEffect, useState } from "react";
import { LineChart } from "charts";
import { FacetedFilterButton } from "ui";
import {
  Select,
  SelectContent,
  SelectGroup,
  SelectItem,
  SelectLabel,
  SelectTrigger,
  SelectValue,
} from "ui";
import { capilatizeFirstLetter } from "~/utils";
import { type ParsedMessage } from "~/websockets/useWS";
import { type LineChartData } from "charts";
import LineComparison from "../line-comparison";

interface LiveChartsProps extends React.HTMLAttributes<HTMLDivElement> {
  sensorData: ParsedMessage[];
}

const LiveCharts: React.FC<LiveChartsProps> = ({ sensorData, ...props }) => {
  const [filters, setFilters] = useState<string[]>(
    getAllAttributes(sensorData.map((message) => message.payload))
  );
  const [dates, setDates] = useState<DateRangePickerValue>({
    from: new Date(),
    to: new Date(),
    selectValue: "tdy",
  });
  const [numberOfColumns, setNumberOfColumns] = useState<1 | 2 | 3>(3);

  const allCharts: LineChartData[] = [];

  useEffect(() => {
    if (filters.length === 0) {
      setFilters(
        getAllAttributes(sensorData.map((message) => message.payload))
      ); // if no filters are selected, select all
    }
  }, [sensorData]);

  // create a chart for each filter and add it to the array
  filters.forEach((filter) => {
    allCharts.push({
      title: capilatizeFirstLetter(filter),
      data: {
        x: sensorData.map((message) => parseFloat(message.acp_ts) * 1000),
        y: sensorData.map((message) => message.payload[filter]),
      },
      xlabel: "Time",
      ylabel: capilatizeFirstLetter(filter),
      labels: [filter],
    });
  });

  return (
    <div {...props}>
      <Flex>
        <div>
          <FacetedFilterButton
            filters={getAllAttributes(
              sensorData.map((message) => message.payload)
            )}
            selectedFilters={filters}
            setSelectedFilters={setFilters}
            title="Filter"
          />
        </div>
        <div className="flex justify-center space-x-2">
          <DateRangePicker
            className="mx-auto  max-w-md "
            value={dates}
            onValueChange={setDates}
            selectPlaceholder="Select"
          />
          <Select
            onValueChange={(value) => {
              setNumberOfColumns(parseInt(value) as 1 | 2 | 3);
            }}
          >
            <SelectTrigger className="h-[37px] w-[70px]">
              <SelectValue placeholder={<Grid size={18} />} />
            </SelectTrigger>
            <SelectContent>
              <SelectGroup>
                <SelectLabel>Layout</SelectLabel>
                <SelectItem value="1">
                  <Rows size={18} />
                </SelectItem>
                <SelectItem value="2">
                  <LayoutGrid size={18} />
                </SelectItem>
                <SelectItem value="3">
                  <Grid size={18} />
                </SelectItem>
              </SelectGroup>
            </SelectContent>
          </Select>
        </div>
      </Flex>
      <div
        className={"mx-auto grid  gap-4 pt-4 " + `grid-cols-${numberOfColumns}`}
      >
        {allCharts.map((chart) => (
          // For all selected charts, create a line chart
          <LineChart
            key={chart.title}
            {...chart}
            dateTime // use date time for x axis (UNIX timestamp)
            chartType="svg" // SVG as WebGL does not allow for more than 8 lines
          />
        ))}
      </div>

      {allCharts.length > 1 && (
        // If there are more than 1 charts, then show the comparison chart component
        <LineComparison className="mt-8" allData={allCharts} />
      )}
    </div>
  );
};

// get all attributes from an object of { string: number}
const getAllAttributes = (obj: { [key: string]: number }[]) =>
  obj.reduce((acc, curr) => {
    Object.keys(curr).forEach((key) => {
      if (!acc.includes(key)) {
        acc.push(key);
      }
    });
    return acc;
  }, [] as string[]);

export default LiveCharts;
We firstly define states for dates and numberOfColumns and then we use the DateRangePicker component from @tremor/react to allow the user to select the date range. We also use the Select component from ui to allow the user to select the number of columns. We then use the grid class from tailwindcss to display the charts in a grid layout. We also pass in the numberOfColumns state to the grid-cols class to change the number of columns.
Horray!
Now we have the LiveCharts components ready to be used in the page. Lets use them in the page.
import { useRouter } from "next/router";
import Layout from "~/components/layout";
import LiveCharts from "~/components/sensors/live-charts";
import LiveMessageList from "~/components/sensors/live-message-list";
import WSStatus from "~/components/ws-status";
import useSubscribeById from "~/websockets/useSubscribeById";

function Page() {
  const router = useRouter();

  const { connectionStatus, rtConnected, messageHistory } = useSubscribeById(
    router.query.id as string | undefined
  );

  if (!router.query.id) {
    return null;
  }

  return (
    <Layout>
      <div className="flex items-center space-x-2">
        <WSStatus
          connectionStatus={connectionStatus}
          rtConnected={rtConnected}
        />
      </div>
      <LiveCharts sensorData={messageHistory} className="mt-4" />
      <LiveMessageList sensorData={messageHistory} className="mt-4" />
    </Layout>
  );
}

export default Page;
Now we have the live data page for each sensor.